-
5Year 5 Worksheets
- Number Properties
-
Division
-
5.5Divisibility Rules with Numbers Up to 10,000

-
5.6Divisibility Rules with Dividend Up to 10,000,000

-
5.7Divisibility Rules

-
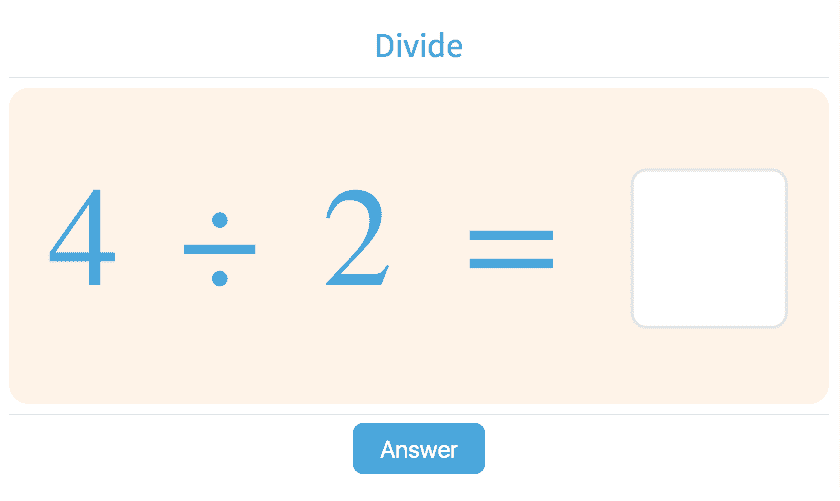
5.26Divide Two Numbers with Operands Up to 12
-
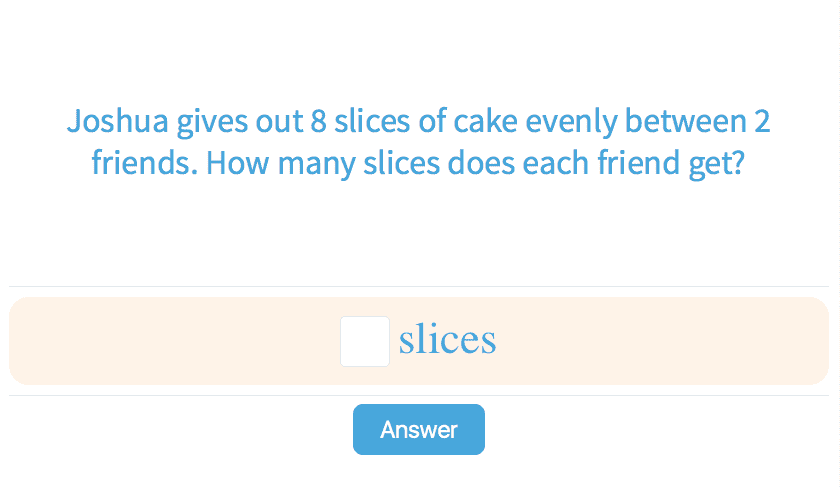
5.27Division with Dividends Up to 60
-
5.28Division with Divisors Up to 100

-
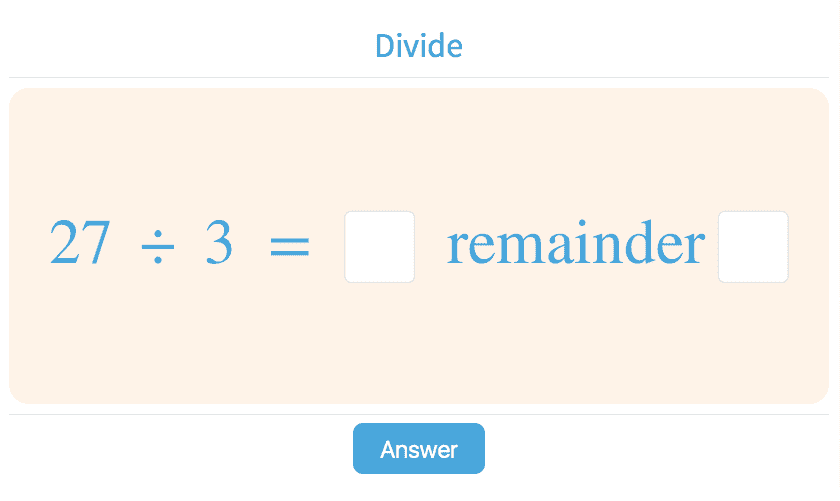
5.29Division with Remainder with Numbers Up to 500
-
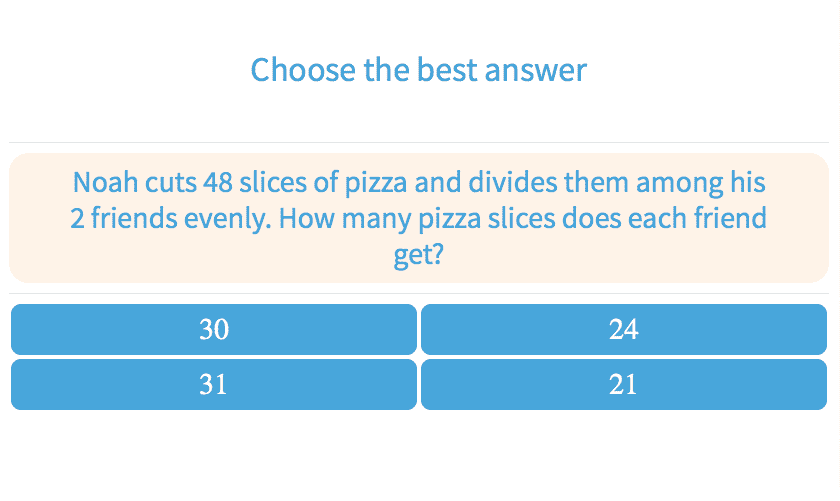
5.30Division with Dividend Up to 1000
-
5.33Divide Numbers Ending in Zeroes

-
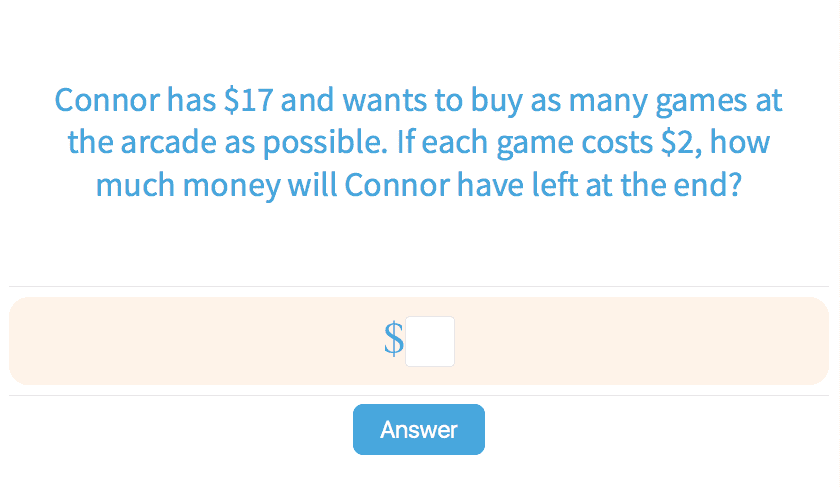
5.34Interpret Remainders
-
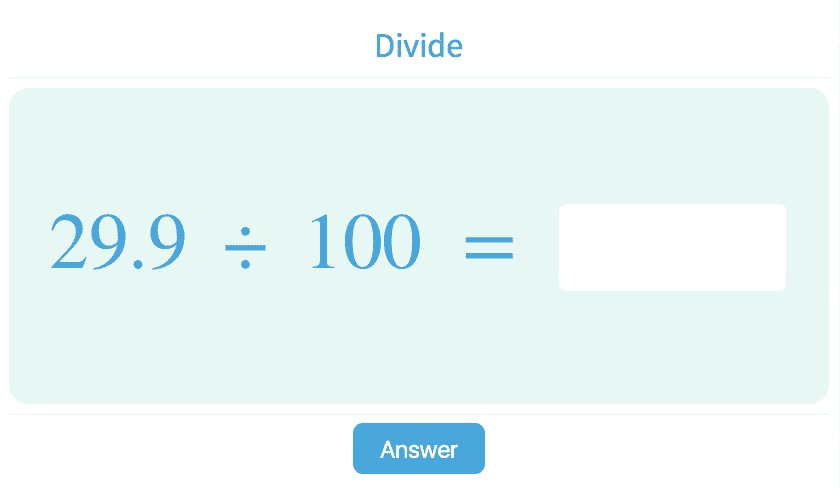
5.51Multiply and Divide Decimals by Powers of Ten
-
-
Estimation
-
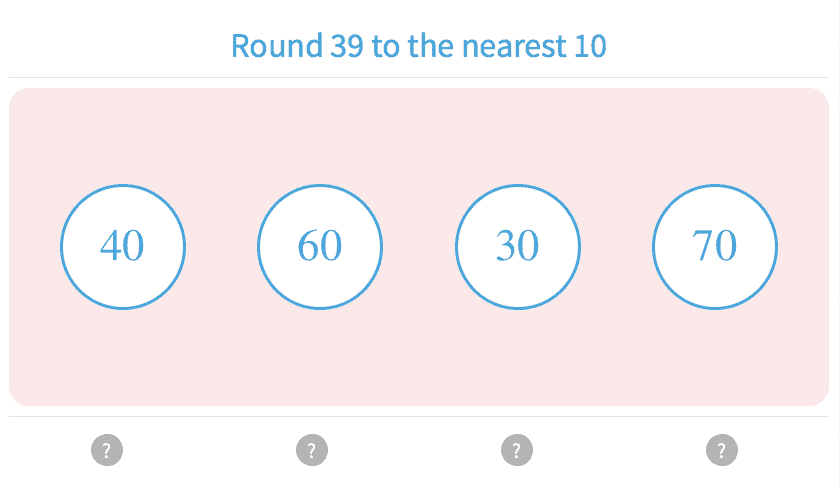
5.8Rounding with Numbers Up to 5000
-
5.9Rounding with Numbers Up to 100,000

-
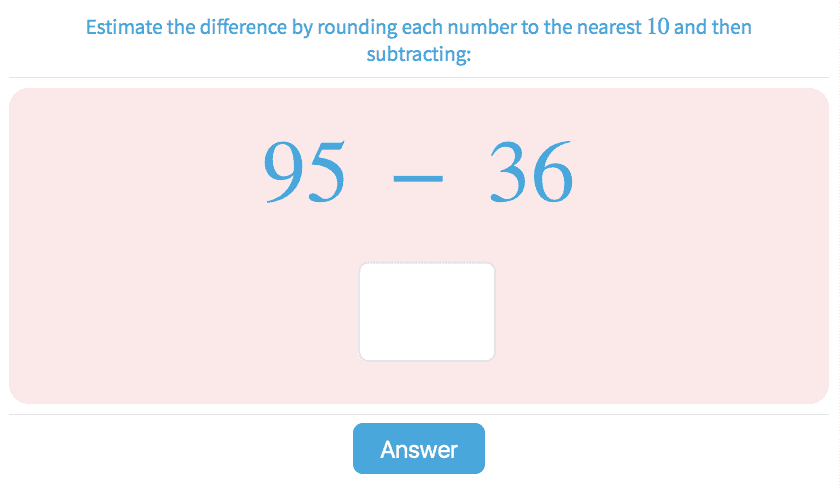
5.10Estimate Differences
-
5.11Estimate Sums with Numbers Up to 100,000
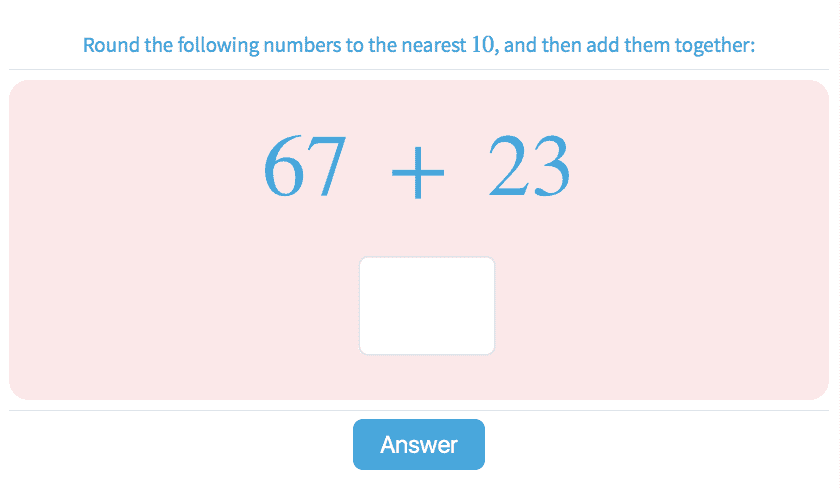
-
5.12Estimate Differences
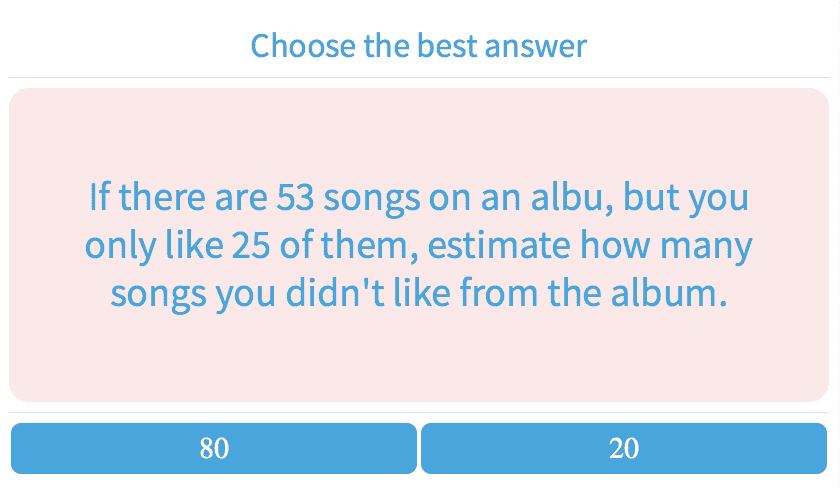
-
5.13Estimate Sums
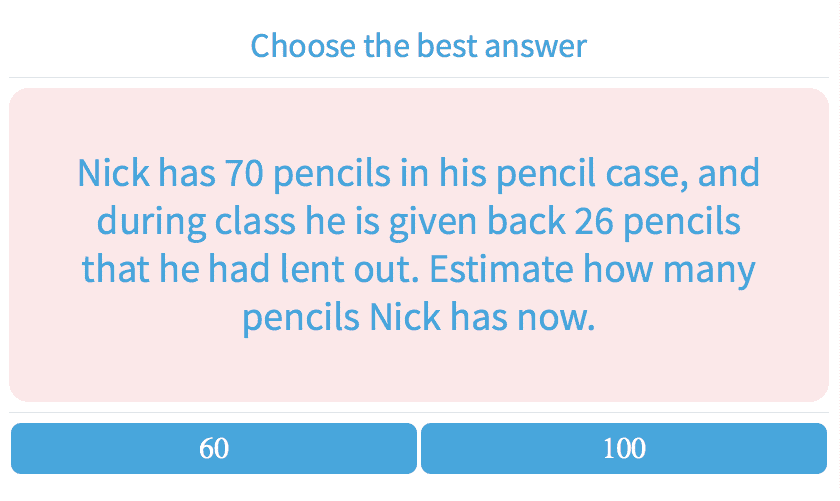
-
5.14Estimate Products Up to 1000
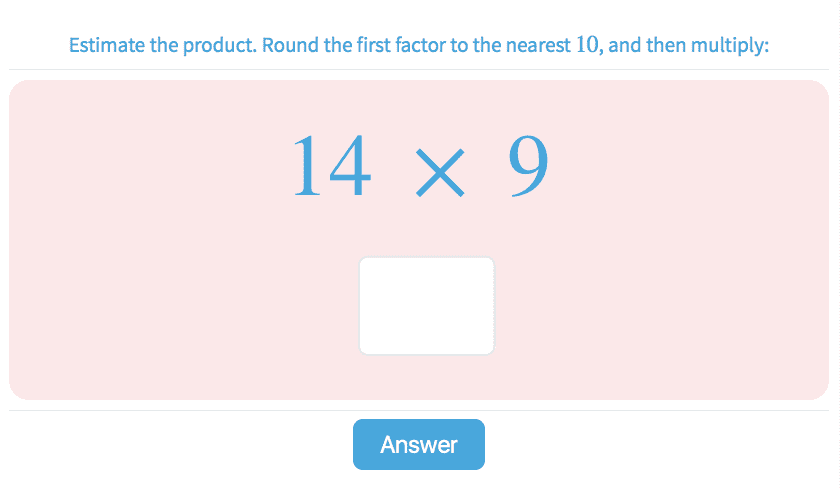
-
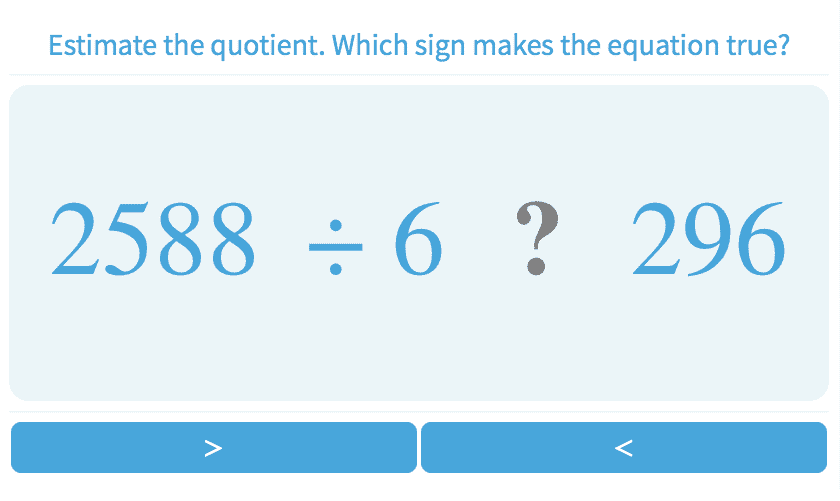
5.15Estimate Quotients
-
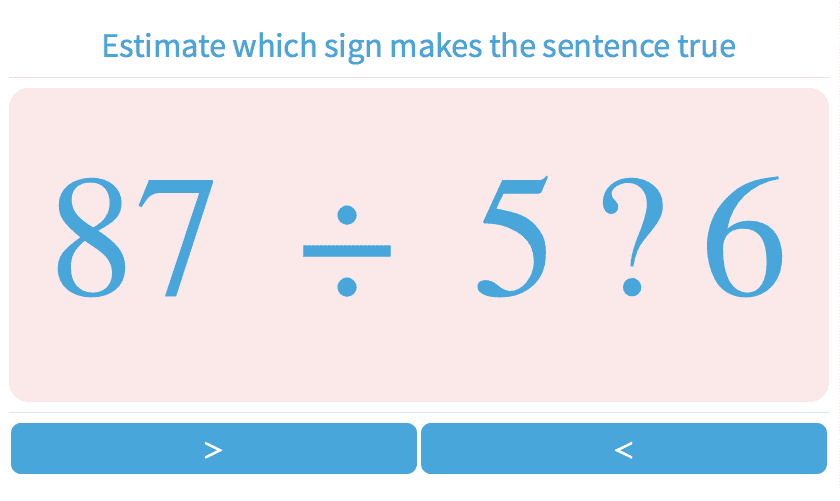
5.16Estimate Quotients Up to 10,000
-
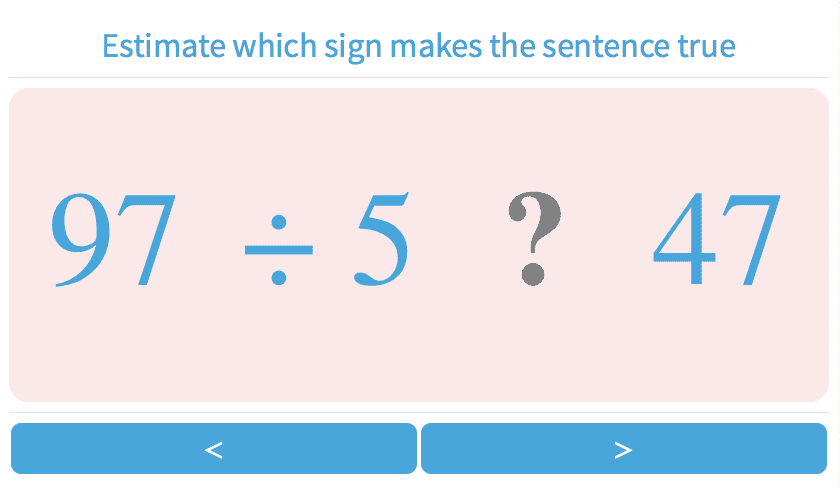
5.17Estimate Quotients Up to 1000
-
-
Fractions
-
5.18Estimate Sums and Differences of Mixed Numbers

-
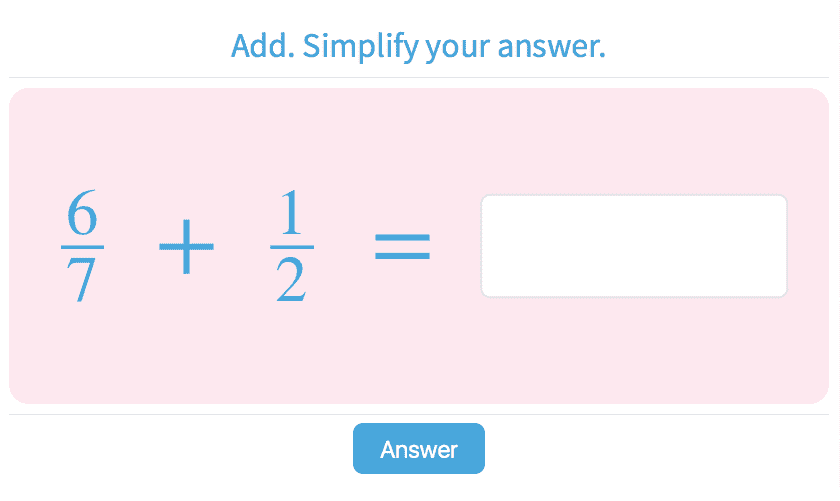
5.43Add and Subtract Fractions
-
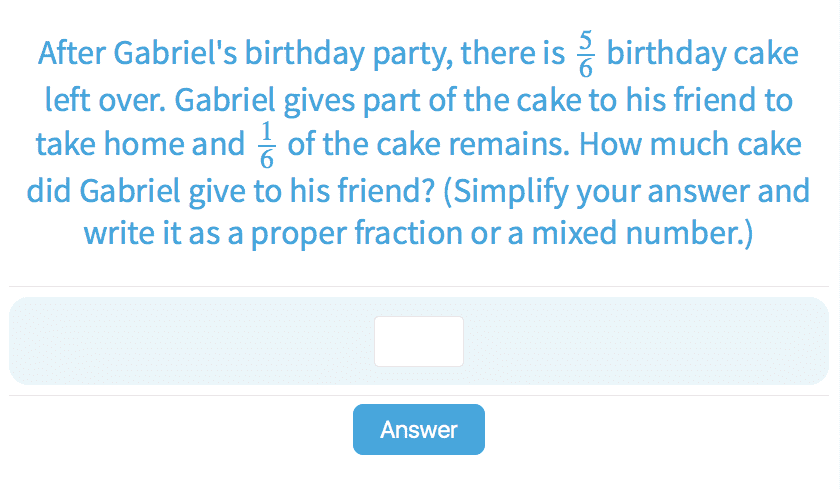
5.44Add, Subtract Fractions with Like Denominators
-
5.45Add Fractions

-
5.46Subtract Fractions

-
5.47Add Two Mixed Fractions

-
5.48Subtract Two Mixed Fractions

-
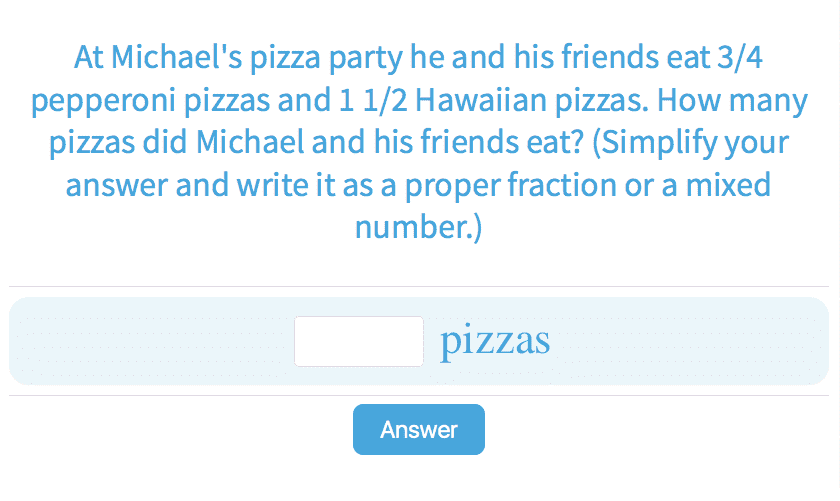
5.49Add and Subtract Mixed Numbers
-
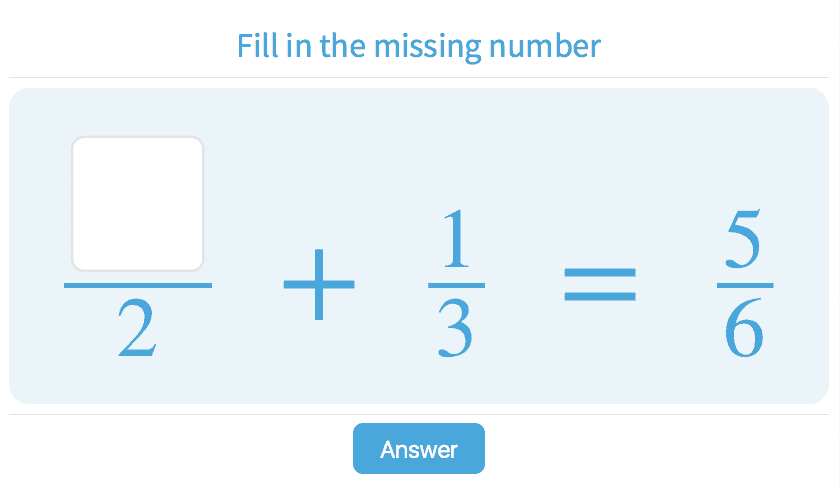
5.50Addition and Subtraction Equations with Fractions
-
5.61Patterns of Equivalent Fractions

-
- Multiplication
- Money
- Addition
- Subtraction
- Mixed Equations
-
Graphing
-
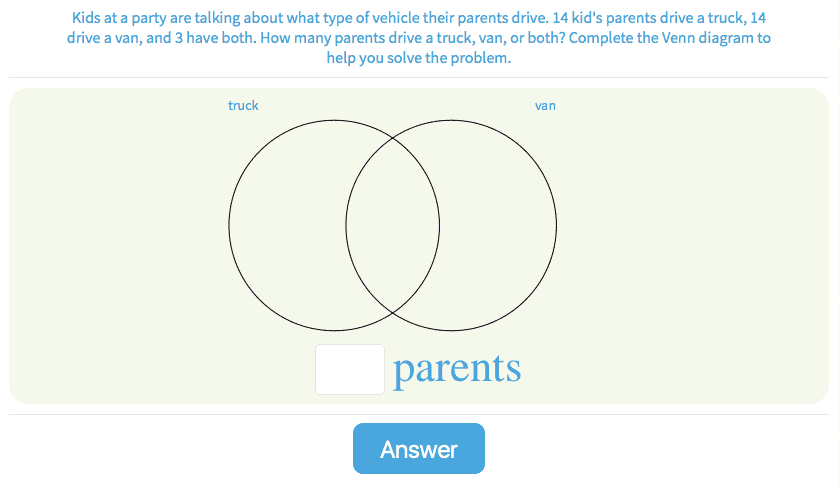
5.42Use Venn Diagrams to Solve Problems
-
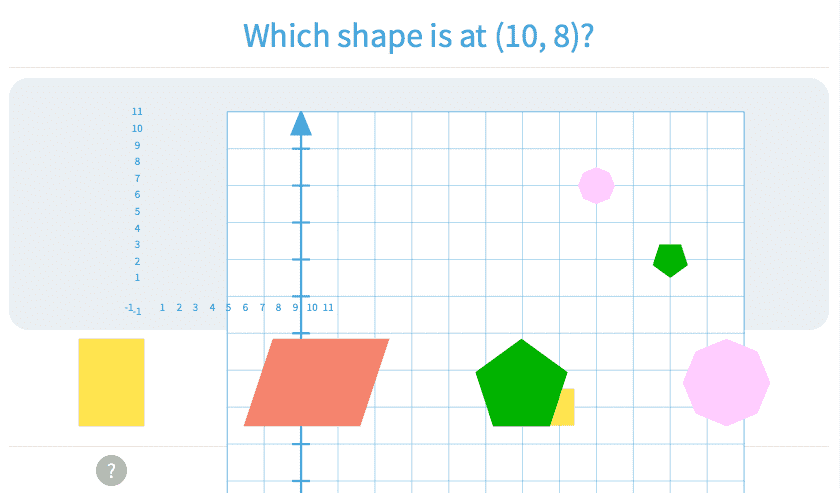
5.71Coordinate Graphs Review with Whole Numbers
-
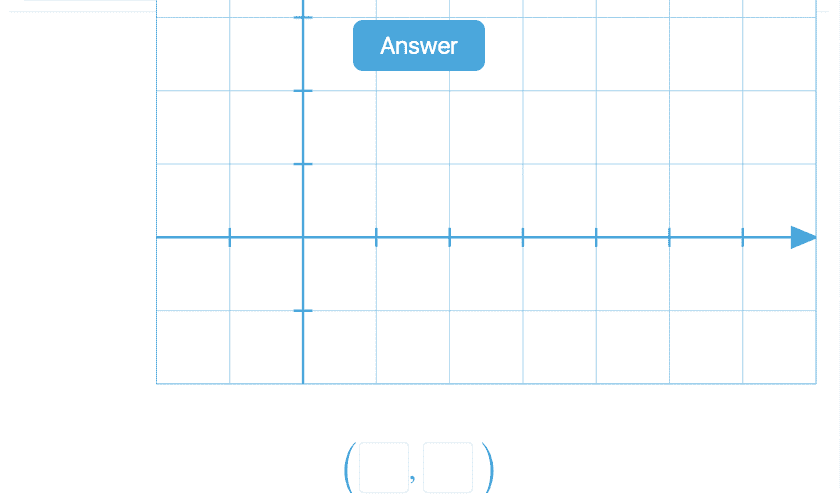
5.73Relative Coordinates
-
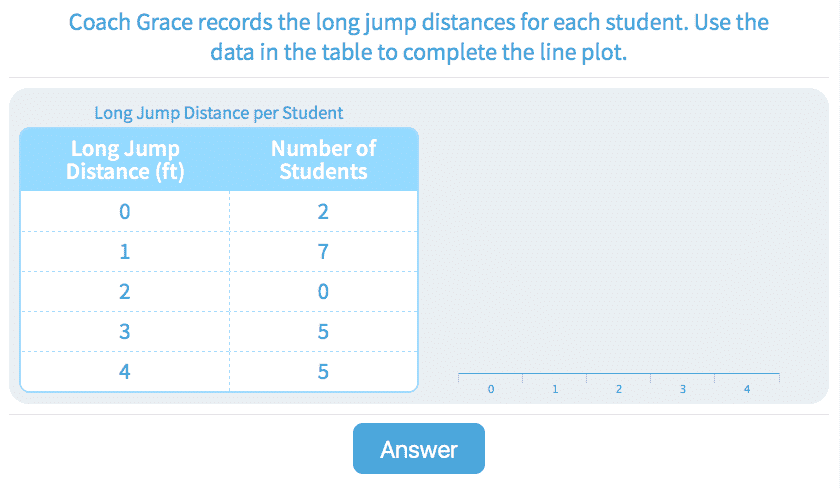
5.88Create Line Plots
-
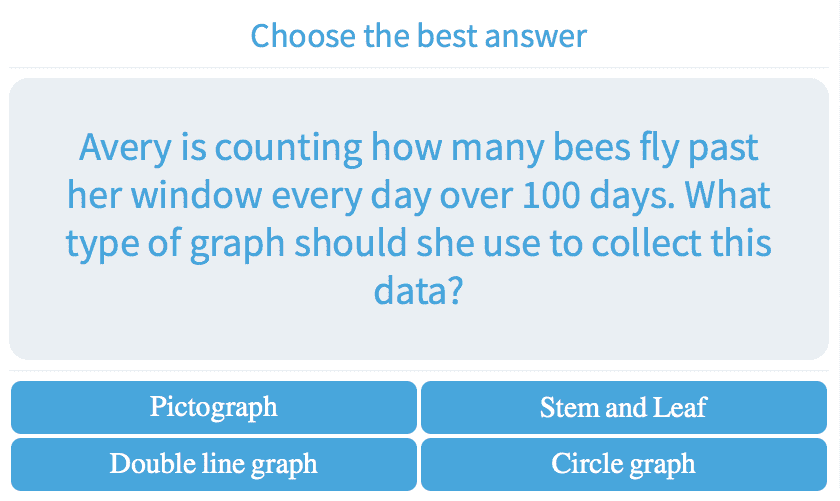
5.90Choose the Best Graph Type
-
5.92Interpret Line Graphs
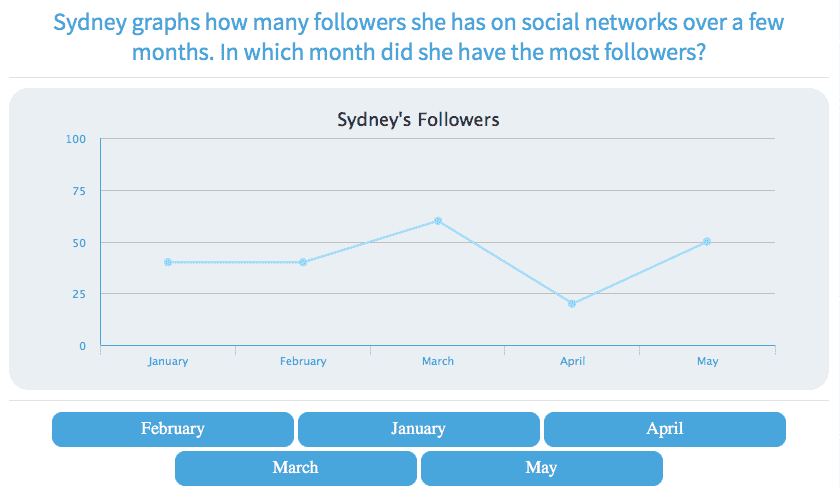
-
5.95Interpret Histograms
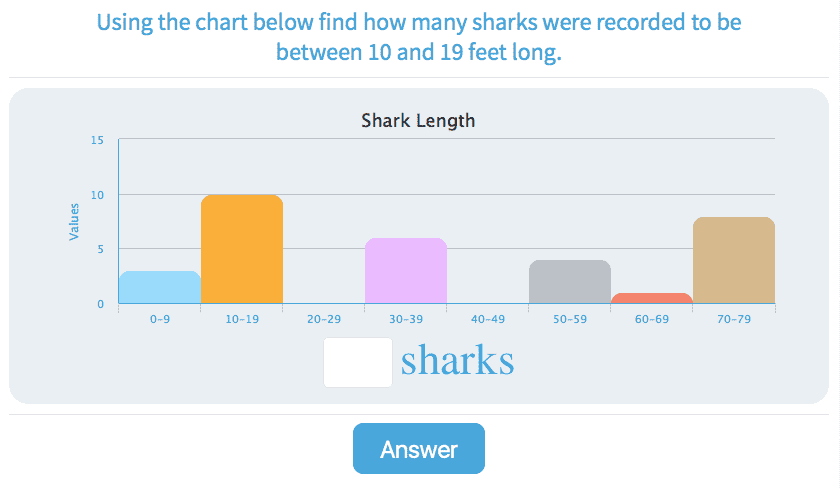
-
5.96Interpret Line Plots
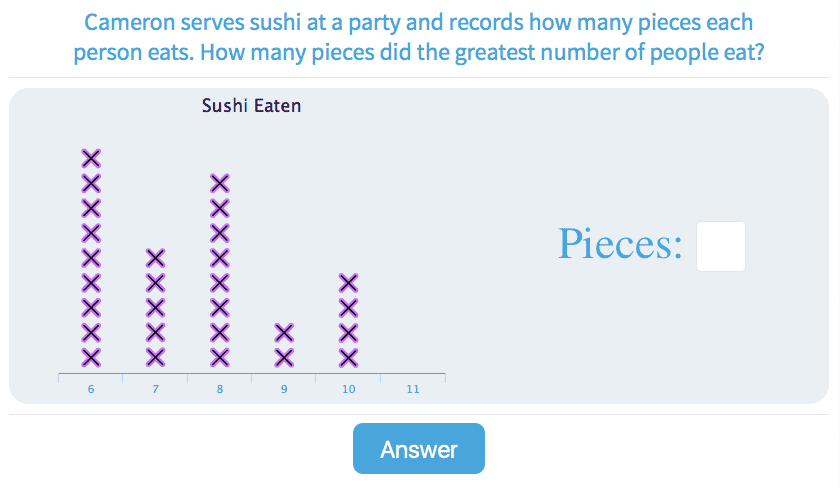
-
5.97Interpret Line Plots with Numbers Up to 40
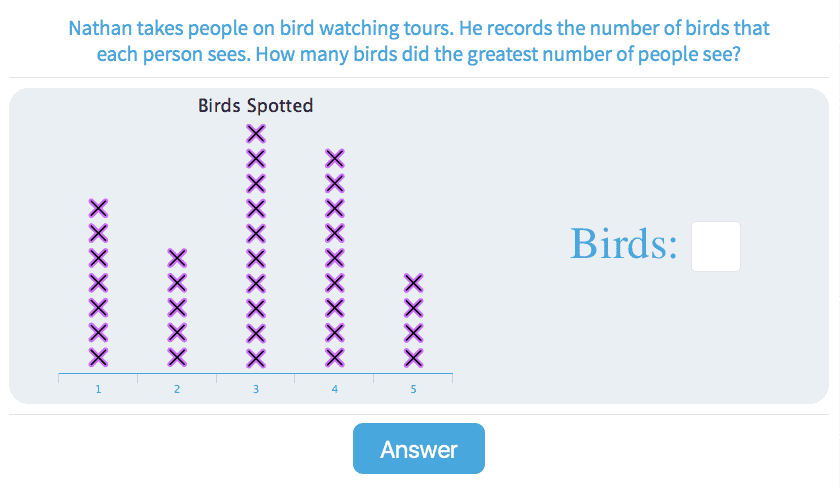
-
5.98Interpret Line Plots with Up to 5 Data Points

-
- Comparison
- Decimals
- Number Patterns
- Measurement
-
Geometry
-
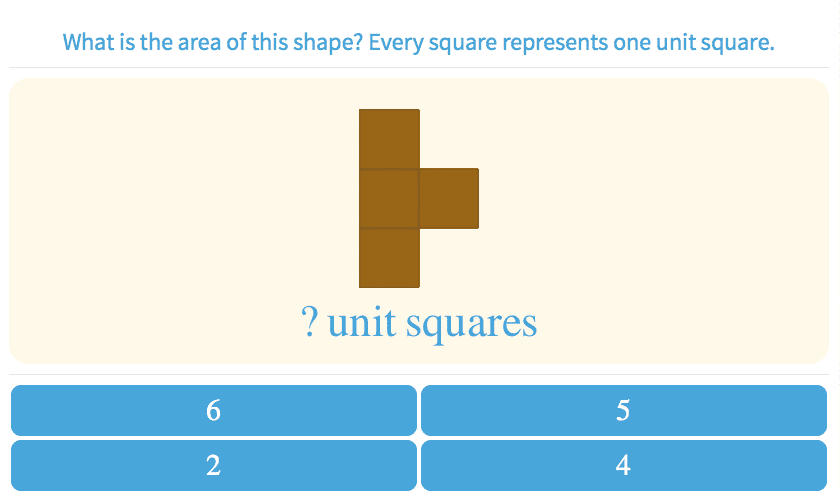
5.65Area with Unit Squares
-
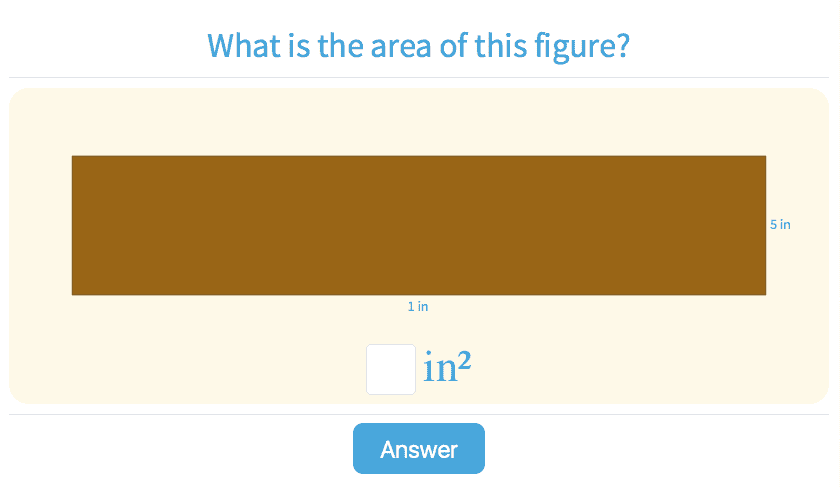
5.66Area of Rectangles
-
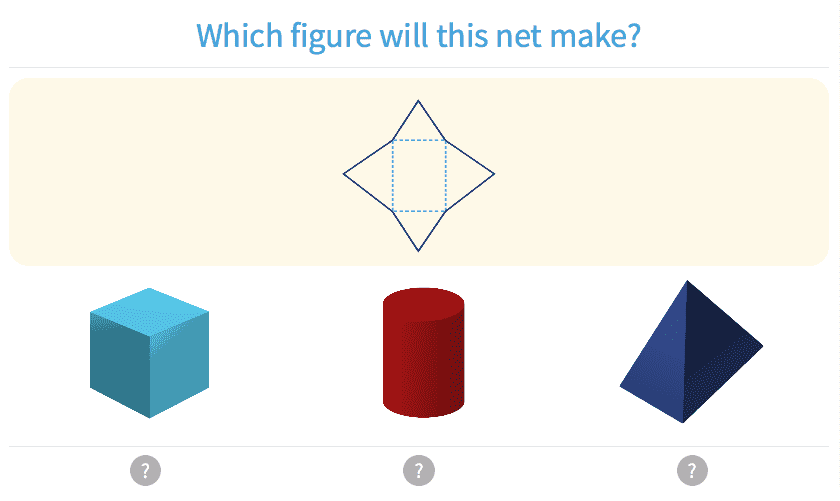
5.67Nets of 3-Dimensional Figures
-
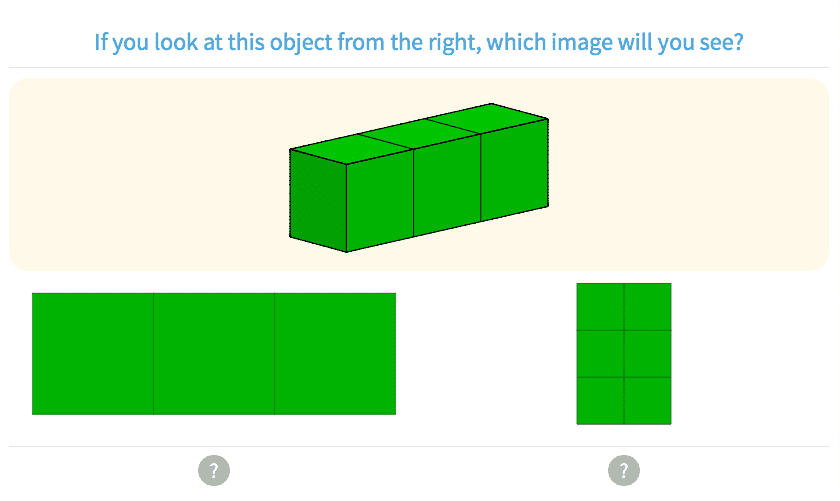
5.68Front, Side, and Top View
-
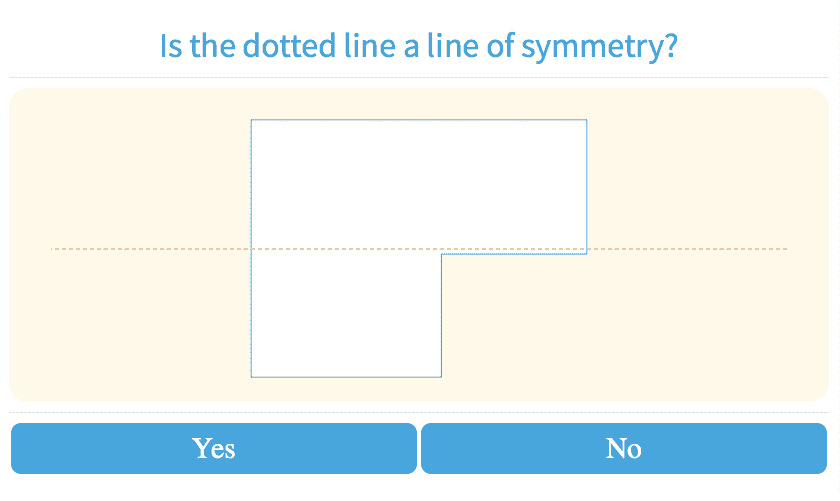
5.74Symmetry
-
5.75Symmetry

-
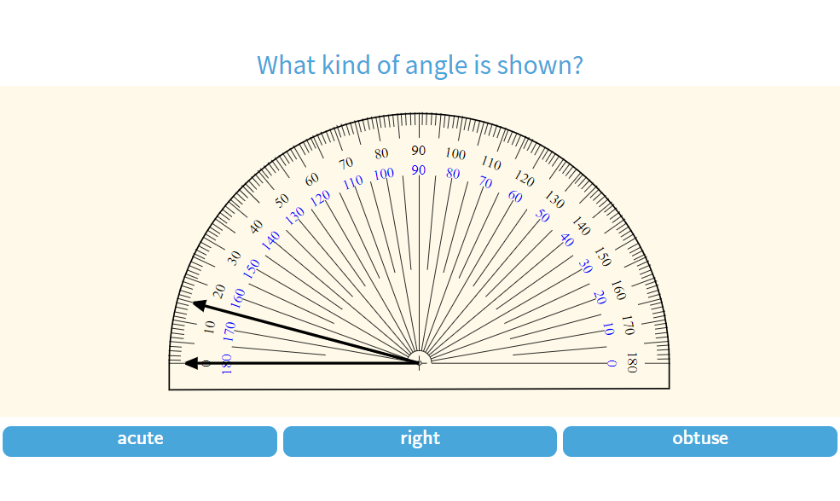
5.77Identify Angles
-
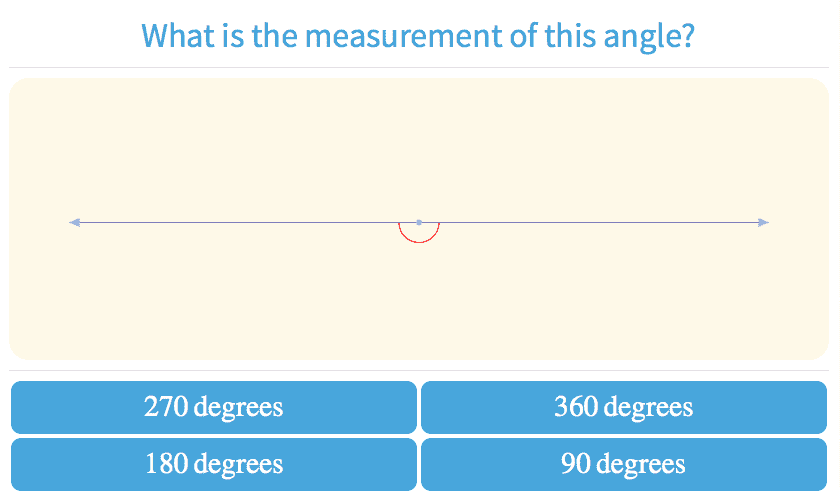
5.78Angles of 90, 180, 270 and 360 Degrees
-
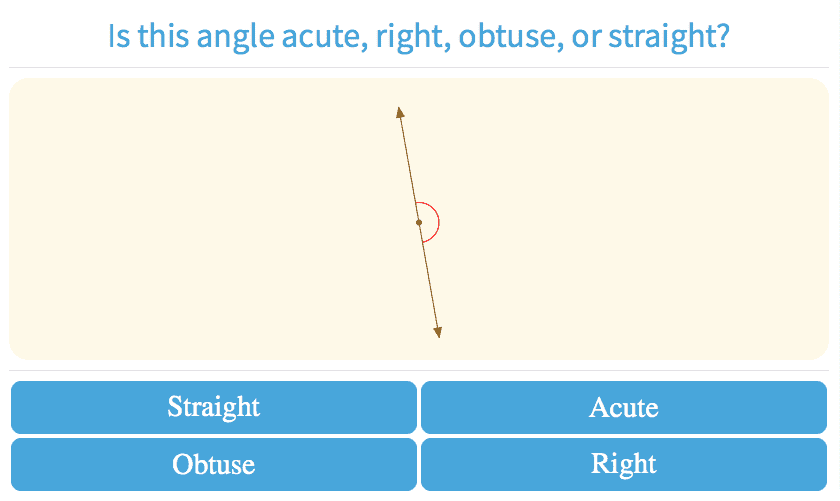
5.79Acute, Right, Obtuse, and Straight Angles
-
- Stats
Students entering the 7th grade continue to expand on concepts from their previous years. On-demand videos with teachers who explain the concepts and show students how to understand the problem-solving process. Teachers go over rules, tips, and multiple problems helping students to be able to solve the problems themselves.
- Students learn about ratios, mixed properties, statistics and other seventh grade skills.
- Teachers incorporate the use of the scratchpad to give students a visual representation.
- Videos provide instant help for students who are struggling with their assignments.
